
There are two types of mNEAT summaries you can review: Reports and Results.
- Reports display overall assessment results and help identify the positive attributes within your local nutrition environment along with opportunities for improvement.
- Results for each completed venue assessment show its total score, category score (food policy, food availability, behavioral design), and responses for each question.
When reviewing your mNEAT score, keep in mind that initial low scores are common and serve as a baseline to drive change and compare results over time. High scores aren’t easy to achieve. Scores are also customized for each venue type to make them reflective of the food and drink options and availability at different types of venues.
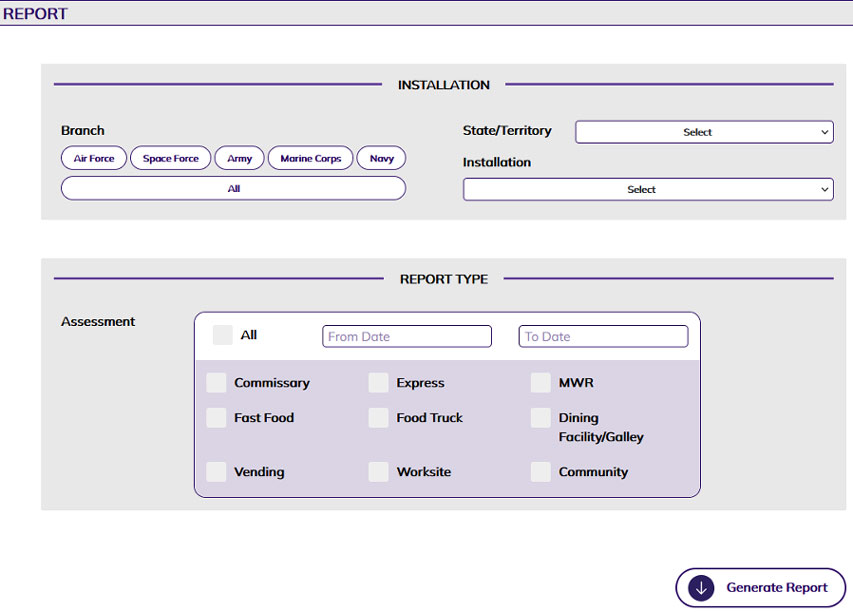 Run an installation or ship report
- Select “Report” from the app’s main navigation menu.
- If you’re an “Assessor,” the report will only include assessments you have submitted.
- If you’re a “Business Unit Administrator,” the reports will include all assessments for the selected installation or ship and assigned service branch.
- Select your service branch and your installation or ship. Tip: Use the “State/Territory” drop-down to filter the list of options.
- Choose the report type and the time frame the assessments were conducted. Note: The “From Date” and “To Date” fields are not required.
- Select “All” to include all of the assessments completed for your installation or ship within the last year.
- Choose specific assessment types such as “Express,” “MWR,” or “Fast Food.”
- Click on “Generate Report” to view the results.
- Click on “Download” to save the report as a PDF.
To learn how to review individual venue assessment scores by question, read the article on interpreting mNEAT results.
 Review your report
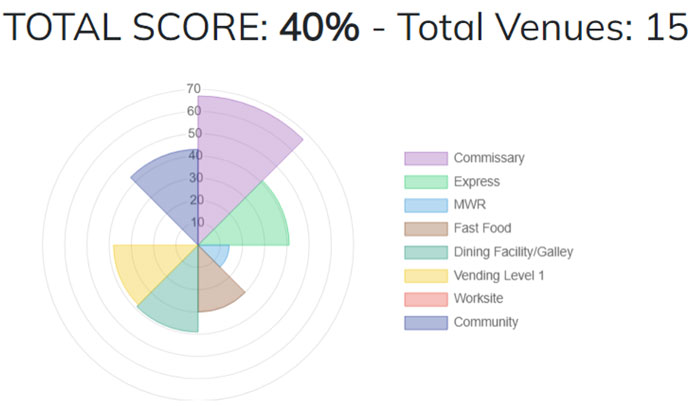
Once you’ve downloaded your local installation or ship’s report, you can review and share the results with your team and stakeholders. There are several key scoring areas and the potential to earn recognition levels.
Scoring recognition levels highlight areas that are more supportive of a healthy nutrition environment. Recognition levels are earned based on the total score of all completed assessments or venue-specific score.
- Recognition levels: Bronze (55–69%), Silver (70–84%), and Gold (85–100%).
The report shows the “Total Score” (percentage) and, if earned, a recognition level (Bronze, Silver, or Gold). It also includes the total number of venues assessed.
 The total score consists of points earned divided by the maximum possible points for each assessment. Note: There are some bonus points for different venues, so it’s possible to have a venue total score greater than 100%.
- The large radial graph visually displays the scores for each venue represented by different colors. The closer to the outer edge of the graph, the higher the score.
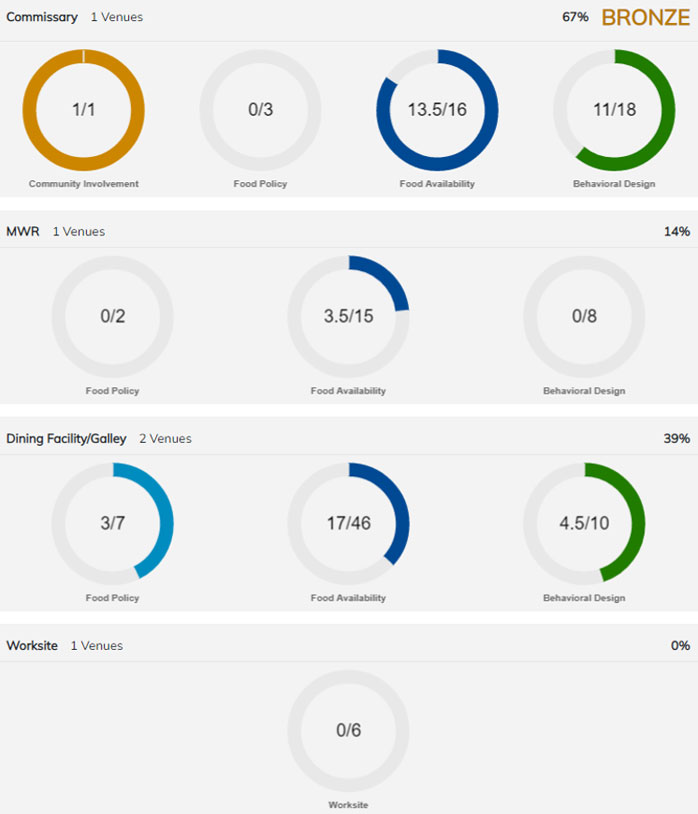
Venue-specific reports are shown with the number of assessed venues, total score (percentage), and (if earned) recognition level (Bronze, Silver, or Gold).
- Radial graphs represent scores within a specific strategy area such as food policy, food availability, or behavioral design.
- The following venues don’t include a strategy area breakdown: Vending Level 1, Worksite, Community, and Vending Level 2.
- The Commissary also includes Community Involvement.
- Within each circle graph, the score represents the points earned out of the total possible points. For example, “Food Availability” for the commissary: 13.5/16 means 13.5 points earned out of 16 possible points.